The Analytics tab provides a view of your hotline activity from various perspectives and allows easy creation of reports for your company.
There are 7 different reports available.
The dashboard provides an overview of incident reports based on the status/risk/priority within a selected date range. The three charts can be filtered based on report attributes selected by level; status (open, closed, pending, unfounded, archived), risk (low, medium, high, undefined) and priority (low, medium, high, and undefined). The default setting displays all. Included below the charts is a list of incident reports based on the date range and criteria selected.
Note: Click the Preview button after changing the filter criteria.
Note: The Internet Explorer browser is not recommended for viewing the Analytics page reports. Please see the 'Recommended Browsers' page in this help file.
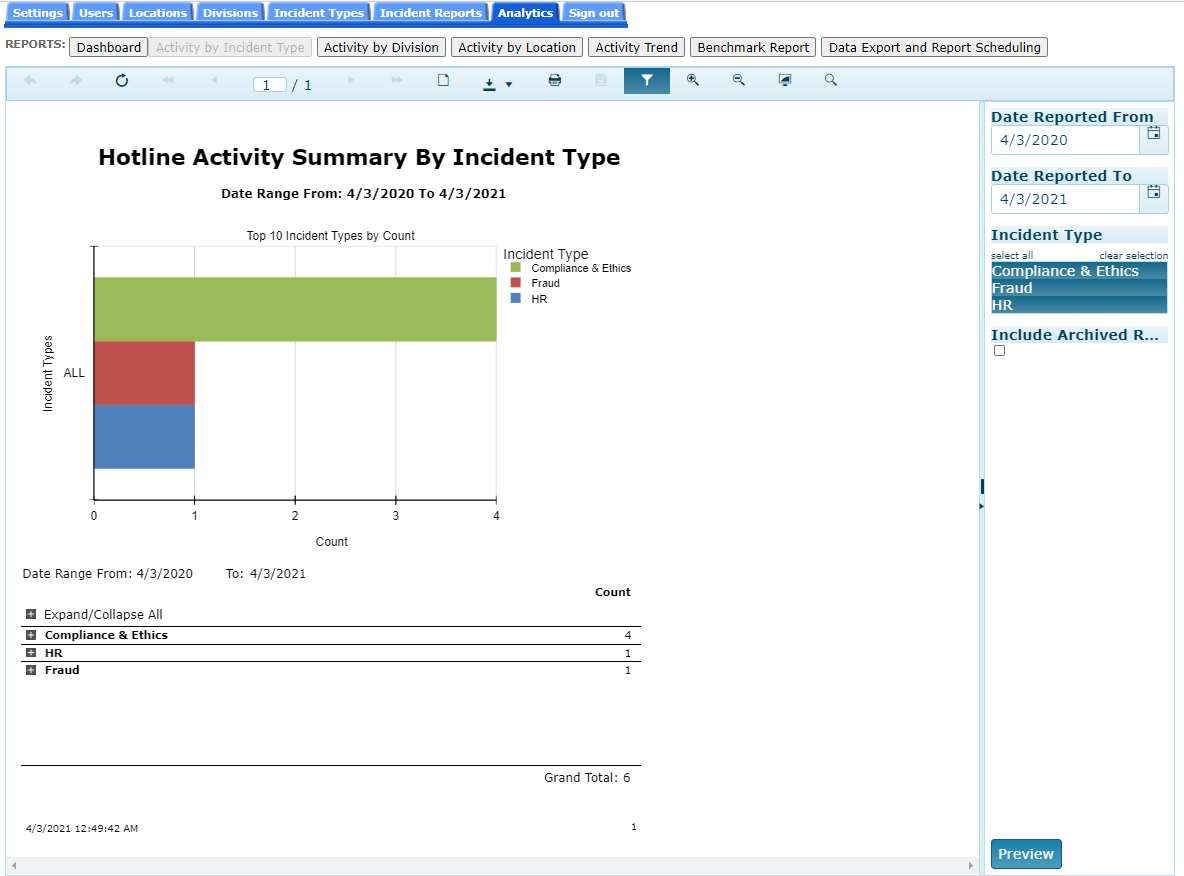
Activity by Incident Type
The Activity by Incident Type is filtered by a selected date range Incident Type. The report displays a chart and a summary count of incident reports, excluding reports with an 'Archived' status, based on the report incident types.
Note: Clicking the + sign to the left of the Incident Type will expand the view to display report details. Clicking the + next to the Expand/Collapse All will expand or collapse all of the report details. To filter the data, change the filter selections at the top of the page and click the 'Preview' button.
Activity by Division
Activity by Division is filtered by a selected date range and Division. The report displays a chart and a summary count of incident reports, excluding reports with an 'Archived' status, based on the report Division field.
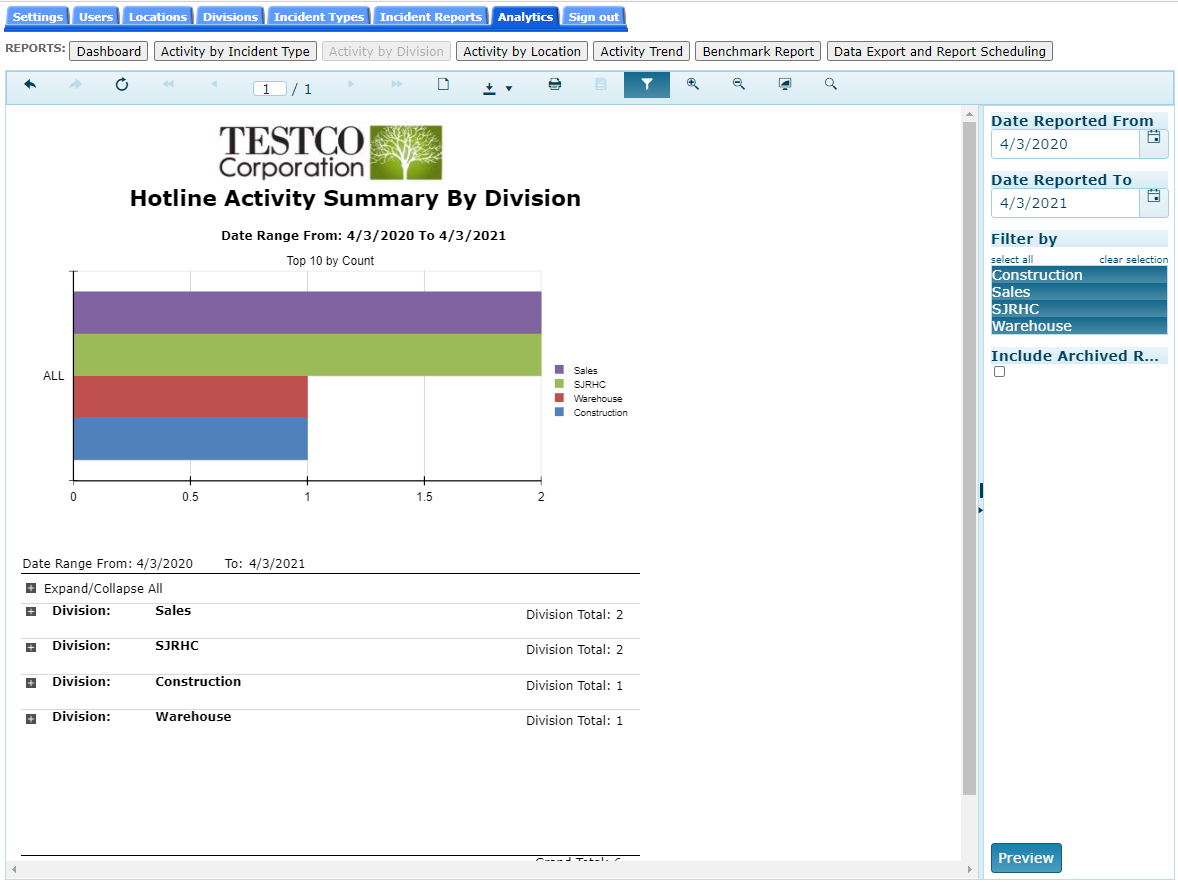
Note: Clicking the + sign to the left of the Division will expand the view to display report details. Clicking the + next to the Expand/Collapse All will expand or collapse all of the report details. To filter the data, change the filter selections at the top of the page and click the 'Preview' button.
Activity by Location
Activity by Location is filtered by a selected date range and Location. The report displays a chart and a summary count of incident reports, excluding reports with an 'Archived' status, based on the report Location field.
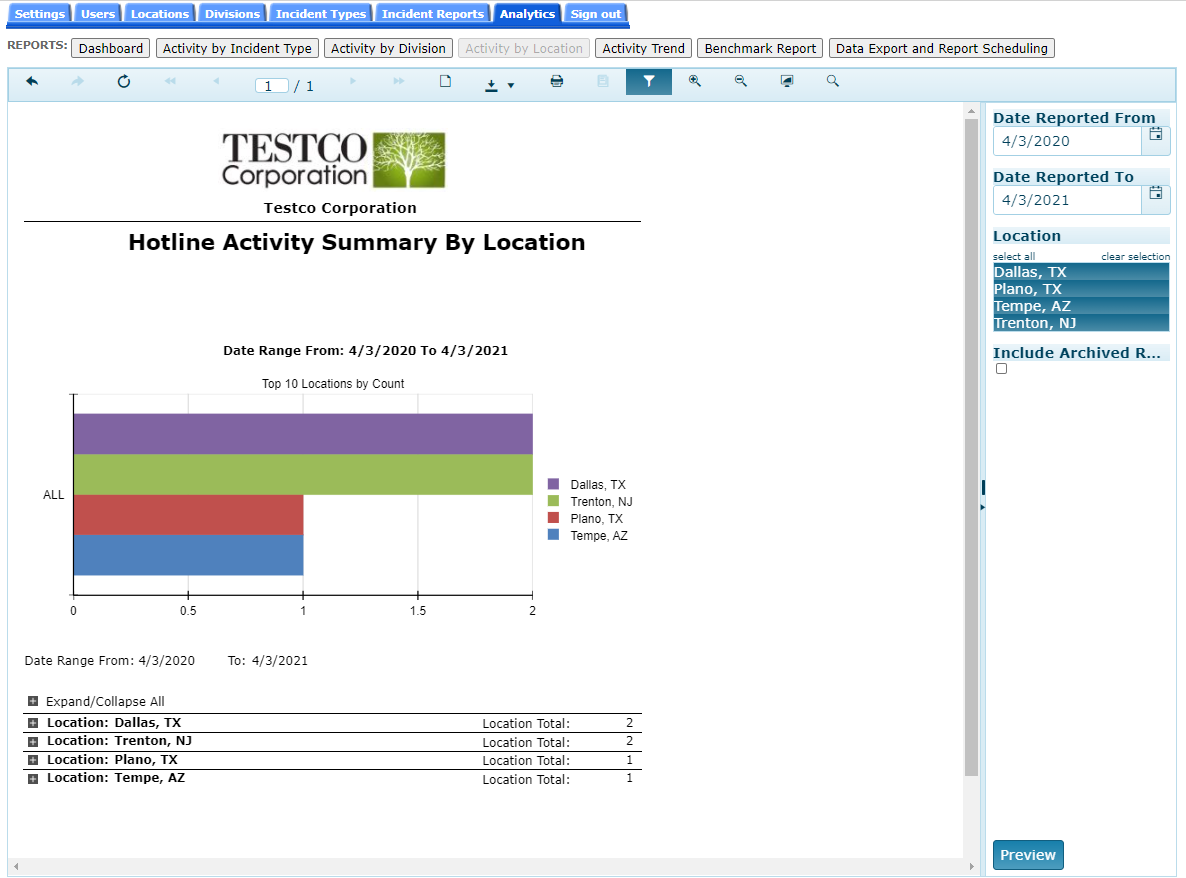
Note: Clicking the + sign to the left of the Location will expand the view to display report details. Clicking the + next to the Expand/Collapse All will expand or collapse all of the report details. To filter the data, change the filter selections at the top of the page and click the 'Preview' button.
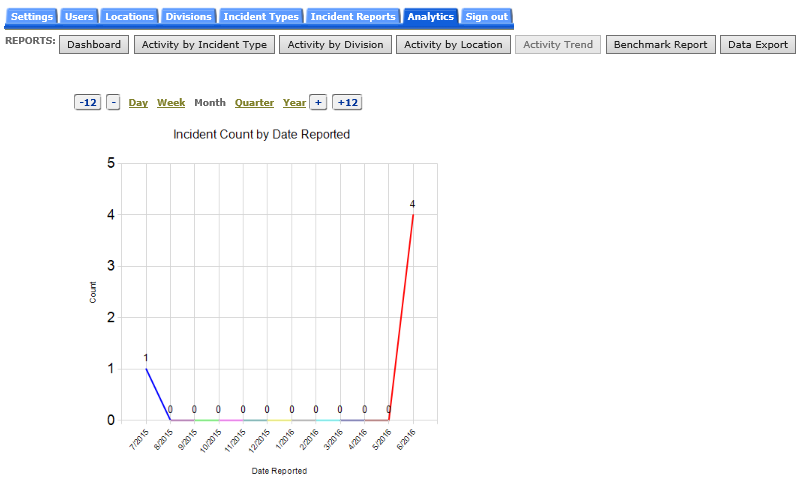
Activity Trend
Activity Trend displays a chart based on the number of reports for a date range selection - per day, week, month, quarter or year.
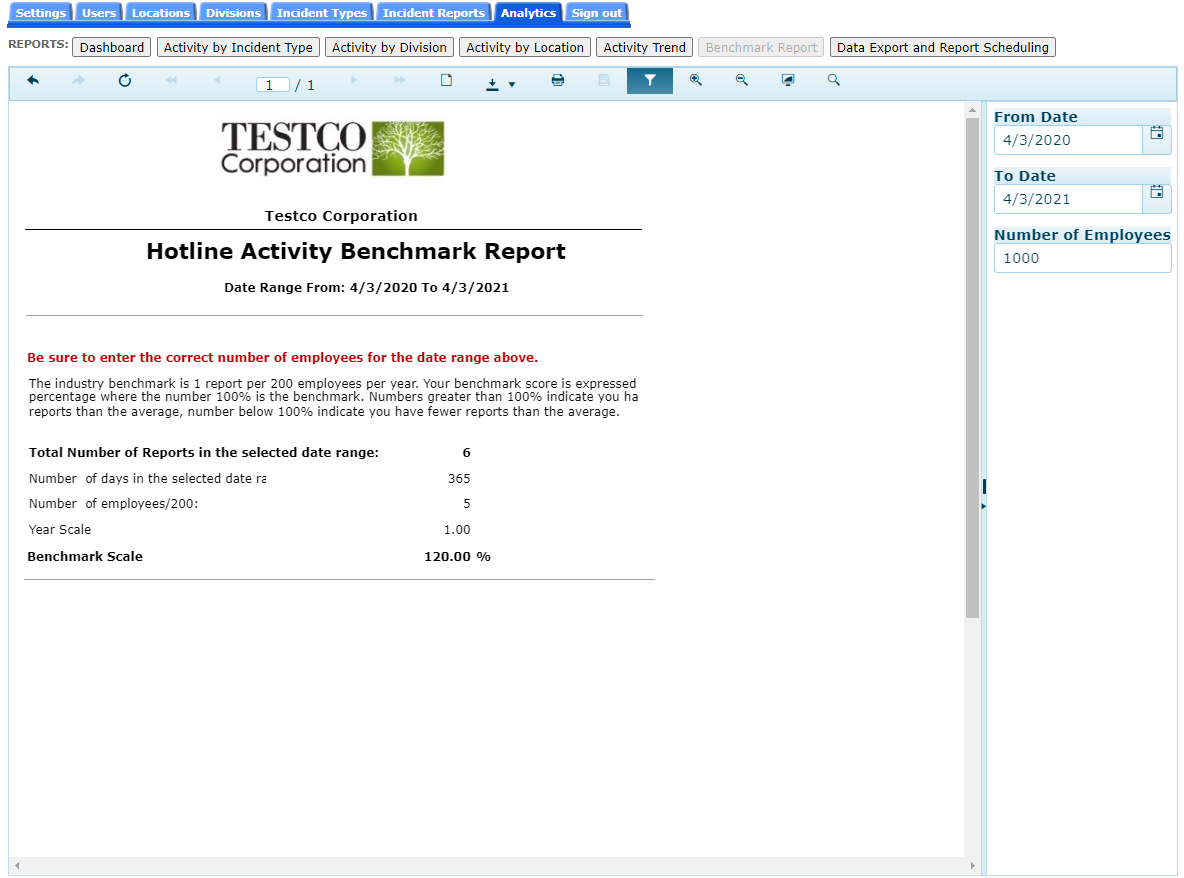
Benchmark Report
The Benchmark Report shows how your company compares to the industry average for the number of reports you’ve received within a date range. It’s important to enter the correct number of employees for the date range selected.
Data Export
The Data Export allows an administrator (or user with access permission) to generate a report containing information related to their company's incident reports. The report will be generated in Excel or CSV format. All reports and their associated data can also be retrieved from the CMS and stored in a data export file. For Enterprise Service Level users, this page also allows the user to create scheduled reports using a template. To get more information on the Report Scheduling feature click here.
Printing Reports
The reports can be printed by clicking the print icon on the toolbar directly above the report. Clicking the print icon will produce a PDF that can then be printed.